
Survey says! Insights from our national survey of pizzeria operators
By Canadian Pizza Staff
News canadian pizza industry canadian pizza magazine Canadian Pizza National Industry Survey canadian pizza survey pizza survey pizza trends pizzeria operators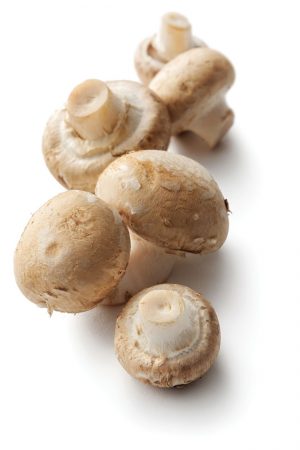 Mushrooms made the top three of best-selling toppings on pizza behind pepperoni and bacon. Photo: Getty Images
Canadian Pizza launched its first national survey of pizzeria operators in 2018.
We wanted to understand the state of Canada’s unique pizza scene, share that information with the industry and use it to help deliver useful articles and information to our readers.
Here are some highlights of what we learned.
OPERATORS
The first Canadian Pizza National Industry Survey polled operators across the country on their business specialties, challenges and needs as operators.
The majority of operators who responded (70%) identified themselves as independent owner/operator/partner; 13% identified as chain or franchise executive/CEO/owner/partner; 9% identified as franchisee; 4% identified as independent senior manager; and 2% labelled themselves chain/franchise senior manager; 2% identified under “other” without specifying.
Many of the pizzerias responding were small operations. Half reported having 1-9 staff members. About one-quarter employ 10-25 staff and just under 20% employ 25-99 staff. Just over 5% have a large staff of 99 or more.
Half of the operators responding to the survey are located in Ontario, 20% are in Alberta, 9% are in Manitoba, 7% are in British Columbia, 7% in Saskatchewan.
A small percentage of operators who took the poll (2%) are from each of Quebec, New Brunswick and Nova Scotia.
SALES
Reports of sales were somewhat encouraging. Nearly half of pizzerias reported their same-store sales over the last 24 months had “expanded somewhat” and about 20% had “expanded significantly.” Just over 20% reported sales had “stayed the same.” On the downside, 11% reported “negative growth.”
The highest sales over the last year, unsurprisingly, came in December, with 30% of operators seeing a rise over the holiday month. Also unsurprisingly, October was the second biggest month, with 18% reporting a bump during National Pizza Month. May and August each saw highest sales for 8% of stores. No store reported highest sales in February.
Pizzerias, overall, were optimistic about future sales: 73% expected sales to pick up in the next six months, while 27% did not expect a rise in sales.
STAFFING
Nearly half of pizzerias reported staffing levels had “stayed the same” over the last two years. The remaining pizzerias were equally split (at 28% each) between having increased and decreased their staff.
Over the next six months, the majority of pizzerias (61%) said they will maintain current levels, 33% said they would add jobs and 6% said they would reduce the number of jobs in their businesses.
TYPE OF PIZZERIA
Many operators (41%) identified their business as “quick service (with seating for less than 12),” while 24% described their business as “quick-service (with seating for 12 or more).” One-quarter were full service and 10% described themselves as “mobile (for example, food truck).”
Most (67%) offer takeout and delivery, 13% offer takeout only, 10% choose to use outside delivery services only, and 5% use a combination of direct delivery and outside services. The rest offer direct delivery only or don’t deliver at all.
BUSINESS NEEDS
Operators were asked to choose the top three business skills they’d like to improve. The skills operators most wanted to learn about were food costing/portioning, leadership/management, digital marketing/social media and marketing/unique selling point. Finance/accounting, cooking/baking skills and recruiting tied to round out the top five.
Many pizzerias said they are looking to invest in social media marketing, marketing and skills training/hiring over the next 12 months. They also plan to invest in a wide range of technologies, equipment and strategies, including (in order of interest):
Social media marketing
- Marketing
- Skills training/hiring
- Staff training
- Setting up website/online ordering
- POS technology
- Kitchen equipment
- Energy efficiency
- Community involvement/charities
- Ovens
- Higher-quality ingredients
- Delivery vehicles
- Store security equipment
- Other (capital expenses, new/different ways to engage with neighbouring residences, capital expenses such as tables, chairs and booths)
- Safety/workplace wellness
MENUS
Aside from pizza, the most significant sources of revenue for operators are wings, salads and pasta. Here are other items making money for pizzerias:
- Wings
- Salads
- Pasta
- Sandwiches
- Other (butter chicken, cold drinks, steak)
- Beer
- Dessert
- Wine
- Spirits
Many pizzerias (60%) described their crust as traditional. Here’s how the other labels shake out:
- Thin-crust – 12.73%
- Other (Calgary Greek style, cracker crust) – 9.09%
- Neapolitan – 7.27%
- Deep-dish – 5.45%
- Pan/Roman – 5.45%
While vegan pizza has not caught on in the same way gluten-friendly/free has, the numbers suggest it figures prominently on pizzeria menus in Canada. About 37% sell vegan pizza with most of those making the pizza in house. More than half said they do not sell vegan pizza; however, at least 10% said they plan to in the next two years.
If you’re looking to make decisions on which toppings (and in what quantity) to stock, here are the toppings operators found were bestsellers, in order of popularity:
- Pepperoni
- Bacon
- Mushrooms
- Ham
- Extra cheese
- Pineapple
- Other (Tandoori chicken, chicken, salami, sweet potato)
- Peppers
- Sausage
- Onions
- Spinach
Desserts and garlic bread were named as items most likely to be added to menus in the next two years.
While clearly there are day-to-day challenges, Canadian pizzeria operators seem optimistic and on the lookout for any competitive edge to keep a healthy bottom line. What will the future hold for your pizzeria?
Results were collected from an independent survey conducted online from May to September 2018. We plan to update the survey every two years.
Print this page